Ichimoku Cloud Analysis
The Ichimoku Cloud is a comprehensive technical analysis tool that provides insight into market trends, support/resistance levels, and momentum.
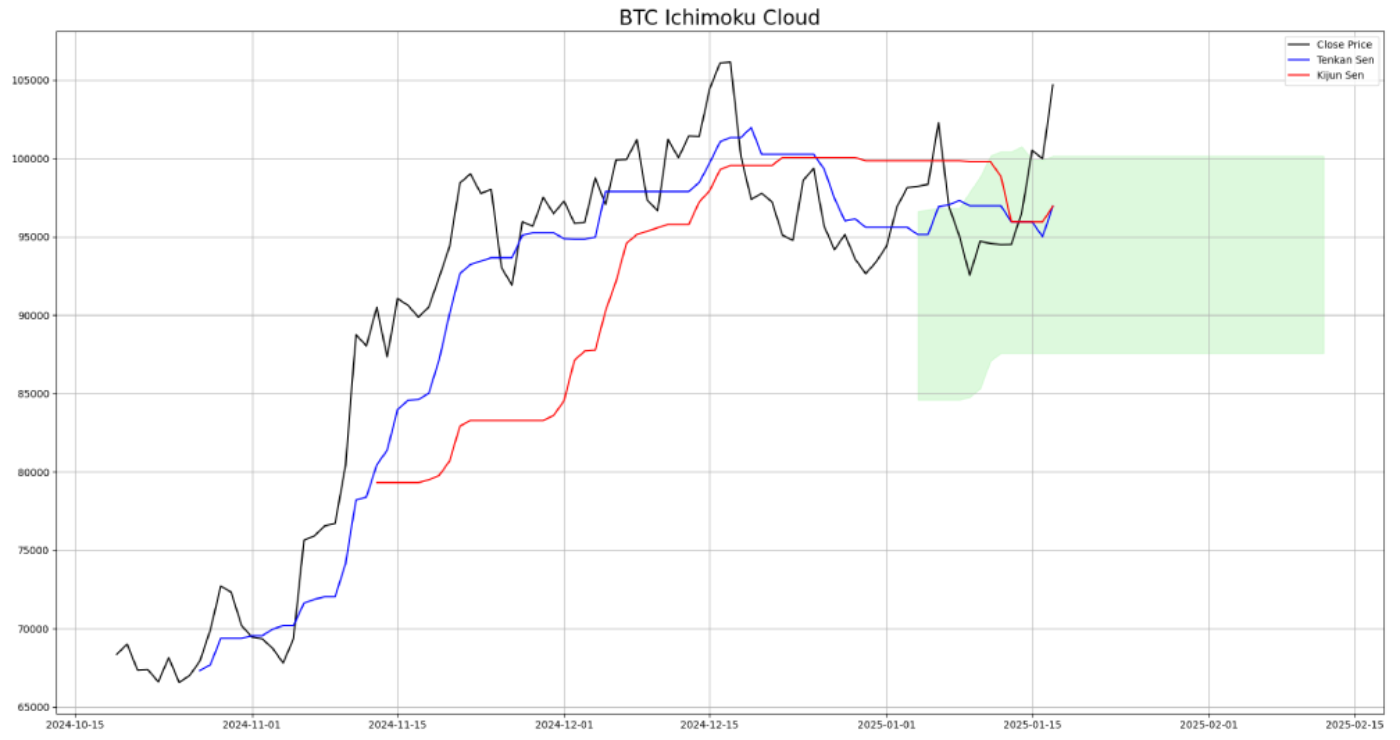
In this example, we analyze a cryptocurrency market using the Ichimoku Cloud. The green shaded area represents the cloud, which acts as dynamic support and resistance.
Chart:
Key Components:
- Tenkan-sen (Blue): Indicates short-term trends (9-period average).
- Kijun-sen (Red): Indicates medium-term trends (26-period average).
- Cloud (Green): Highlights potential support and resistance zones.
This chart shows how the Ichimoku Cloud can be used to identify potential entry and exit points based on price movements relative to the cloud and the Tenkan/Kijun lines.