Analytical Plot Example
Below is a sample of the detailed analysis we provide. This plot showcases how we break down price trends, trading volume, and key technical indicators to help you make informed decisions in the crypto market.
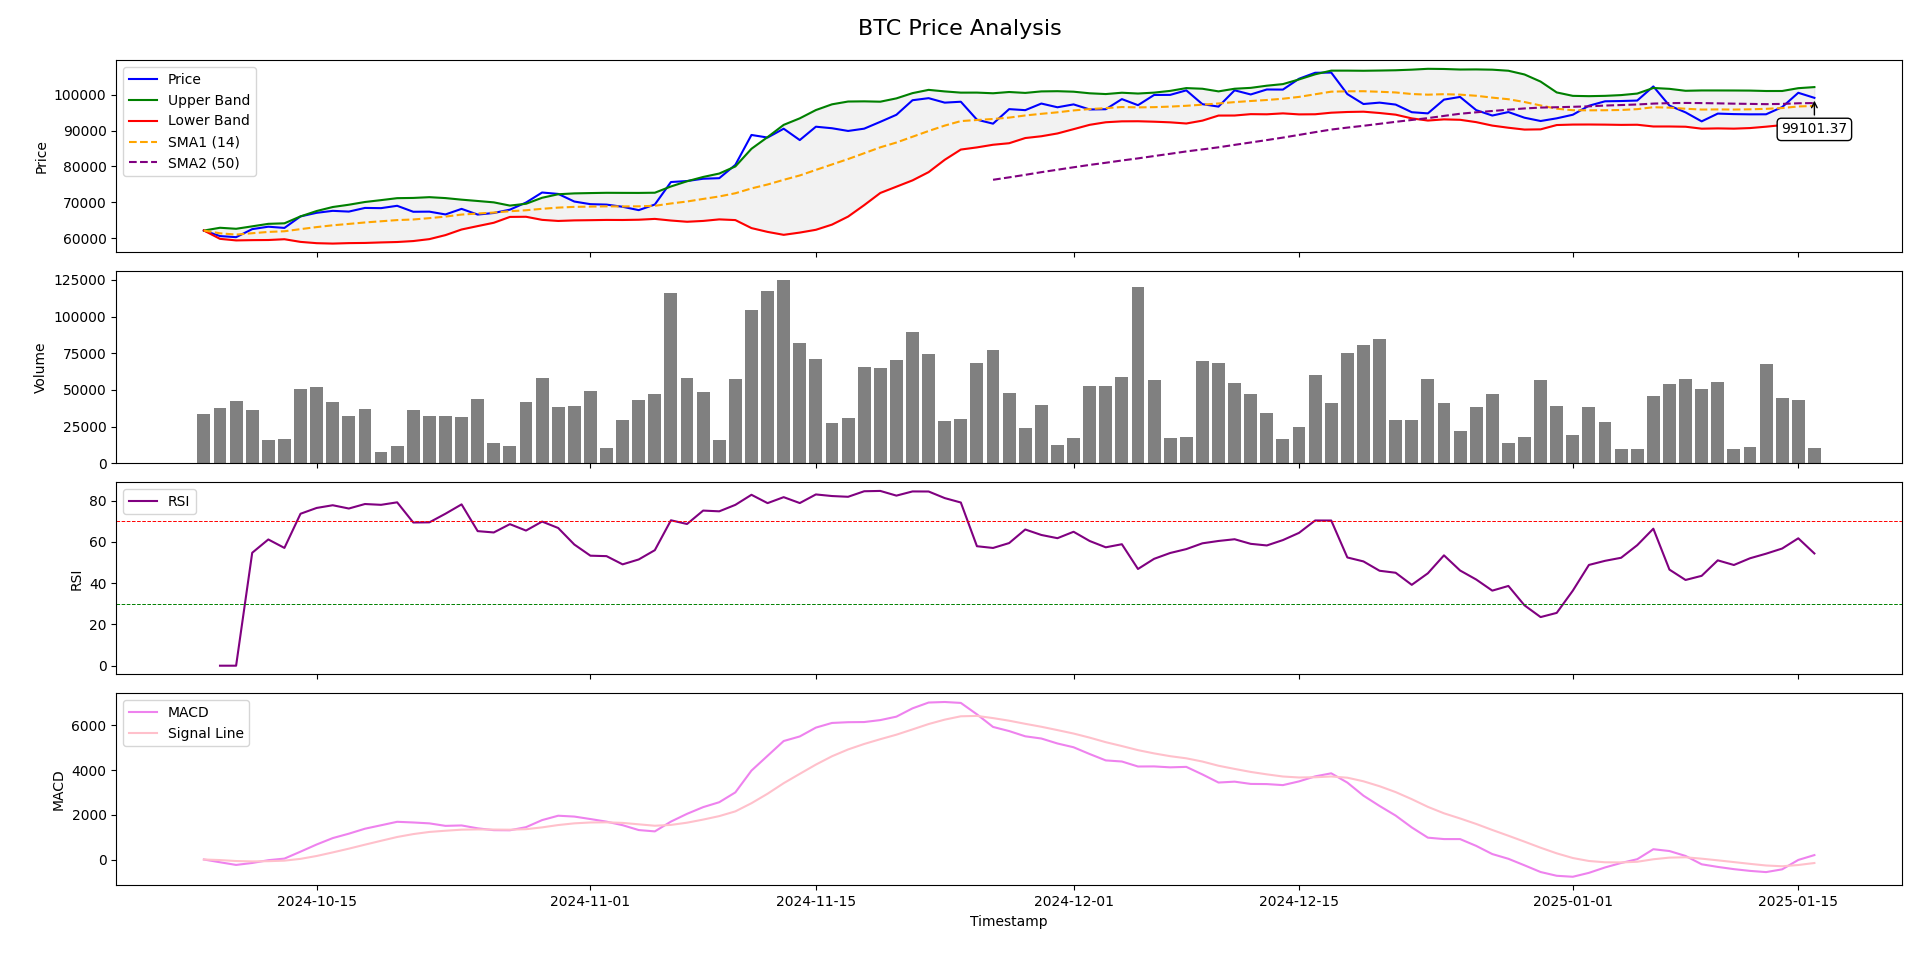
Figure: BTC Price Analysis with Bollinger Bands, RSI, and MACD
Key Insights
- Support and Resistance Levels: Identify key price levels where Bitcoin has historically reversed trends.
- RSI Analysis: Spot overbought and oversold conditions to time your trades effectively.
- MACD Trends: Leverage crossover signals to predict bullish or bearish momentum shifts.
Fundamental Analysis
Our comprehensive approach includes analysis of major events impacting Bitcoin, such as regulatory updates, macroeconomic trends, and market sentiment shifts. These factors, combined with technical insights, provide a holistic view for better trading strategies.